搭配其他插件使用
tab content 使用 MarkdownRenderer.render() 渲染,即使用的是 ob 的阅读模式渲染,因此能够与许多插件搭配着使用。
Markdown 嵌套使用代码块
Markdown 有两种嵌套使用代码块的格式:
只用一种反引号时,外层代码块使用反引号的个数必须多于内层代码块使用的反引号个数
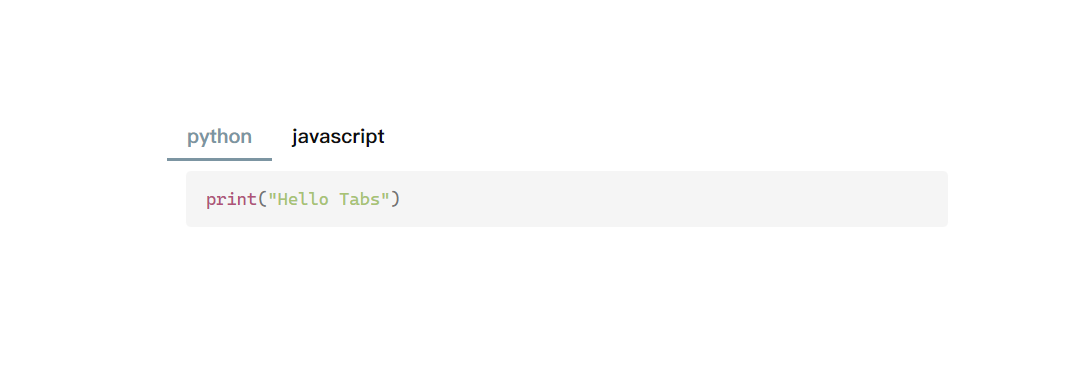
````tabs
tab: python
```python
print("Hello Tabs")
```

tab: javascript
```javascript
console.log('Hello Tabs');
````
同时使用两种反引号生成代码块时,只需要同种反引号保持外层多于内层即可
~~~tabs
tab: python
```python
print("Hello Tabs")
```

tab: javascript
```javascript
console.log('Hello Tabs');
```
~~~
With Dataview & Tasks
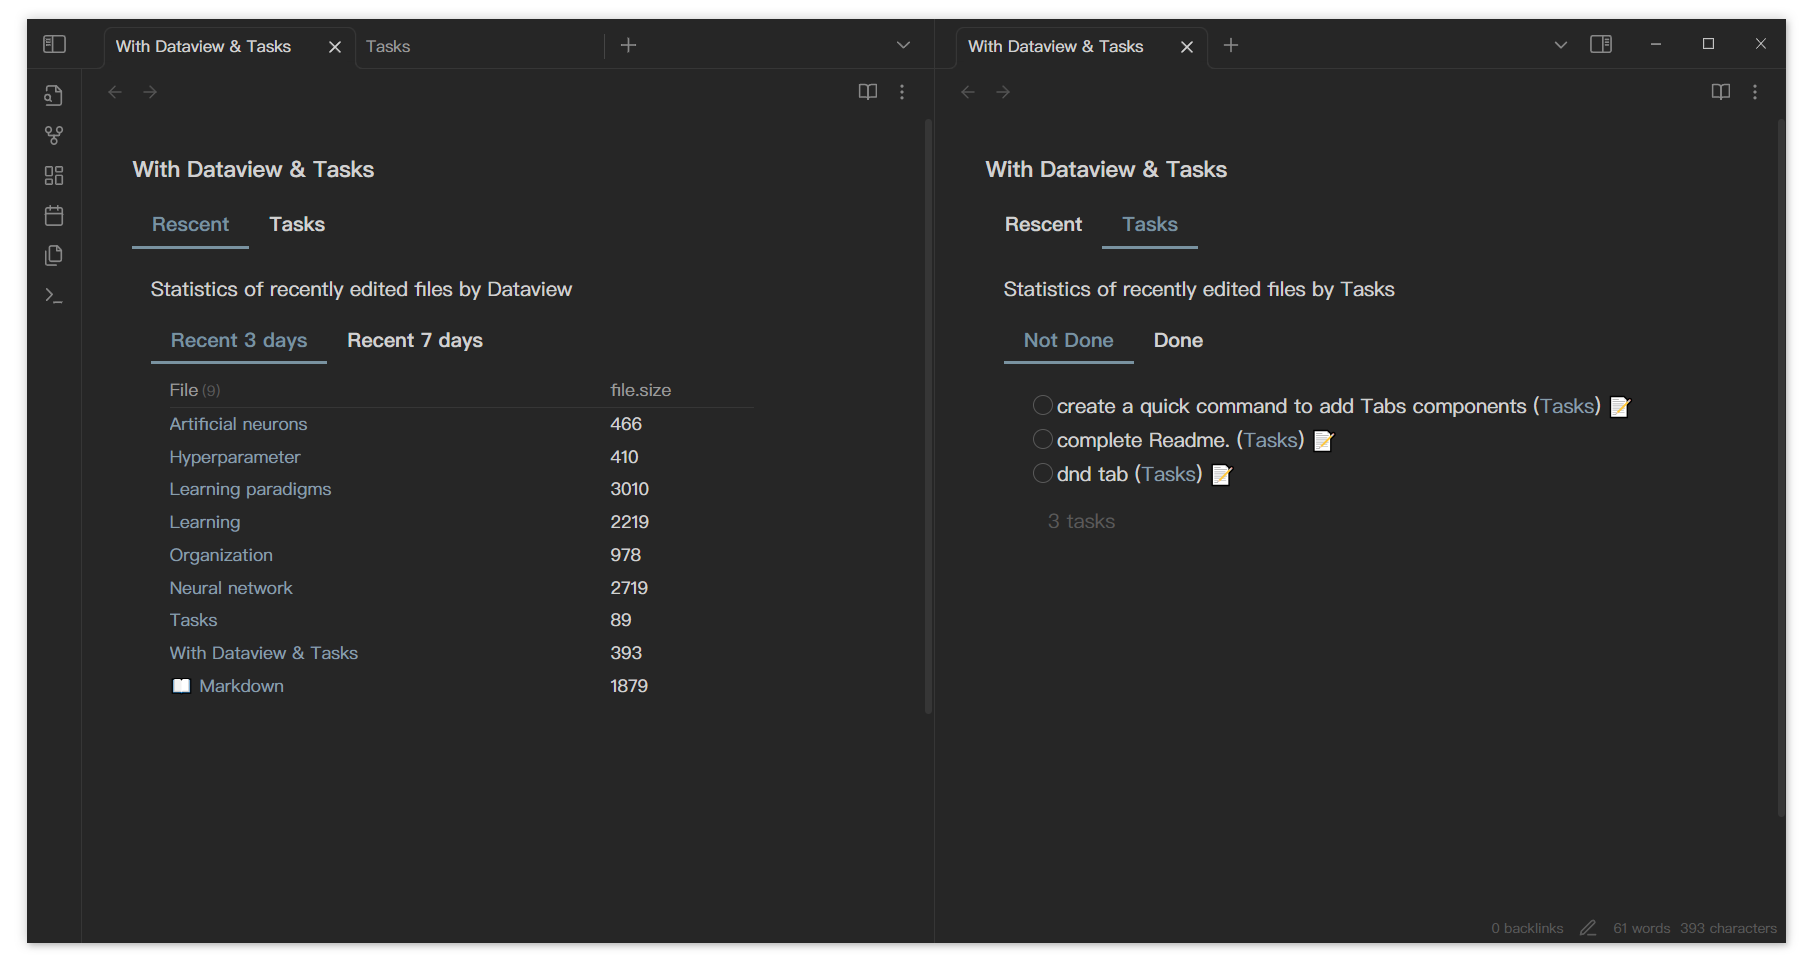

From DeusEx01
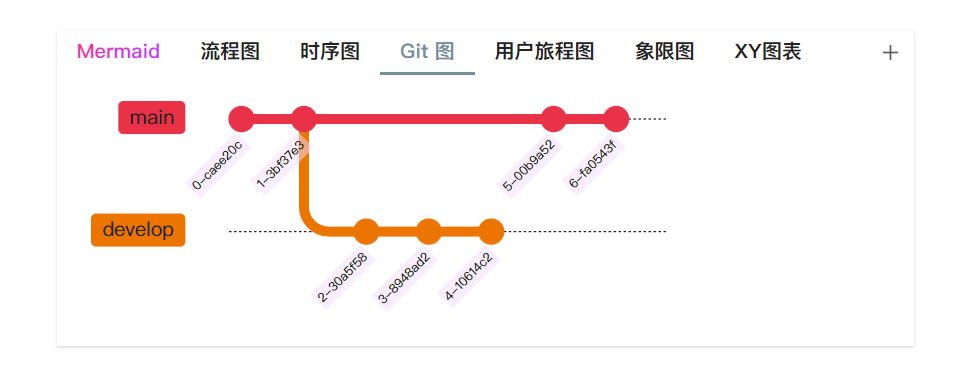
With mermaid
源码
md
````tabs

tab: <span style="color: transparent; background:-webkit-linear-gradient(120deg, #bd34fe 30%, #ff3670); -webkit-background-clip: text; -webkit-text-fill-color: transparent;">Mermaid</span>
Mermaid 允许你使用文本和代码创建图表和可视化。

它是一个基于 JavaScript 的图表绘制工具,可渲染 Markdown 启发的文本定义以动态创建和修改图表。
tab: 流程图
```mermaid
graph TD;
    A-->B;
    A-->C;
    B-->D;
    C-->D;
```
tab: 时序图
```mermaid
sequenceDiagram
    participant Alice
    participant Bob
    Alice->>John: Hello John, how are you?
    loop HealthCheck
        John->>John: Fight against hypochondria
    end
    Note right of John: Rational thoughts <br/>prevail!
    John-->>Alice: Great!
    John->>Bob: How about you?
    Bob-->>John: Jolly good!
```
tab: Git 图
```mermaid
    gitGraph
       commit
       commit
       branch develop
       commit
       commit
       commit
       checkout main
       commit
       commit
```
tab: 用户旅程图
```mermaid
journey
    title My working day
    section Go to work
      Make tea: 5: Me
      Go upstairs: 3: Me
      Do work: 1: Me, Cat
    section Go home
      Go downstairs: 5: Me
      Sit down: 5: Me
```
tab: 象限图
```mermaid
quadrantChart
    title Reach and engagement of campaigns
    x-axis Low Reach --> High Reach
    y-axis Low Engagement --> High Engagement
    quadrant-1 We should expand
    quadrant-2 Need to promote
    quadrant-3 Re-evaluate
    quadrant-4 May be improved
    Campaign A: [0.3, 0.6]
    Campaign B: [0.45, 0.23]
    Campaign C: [0.57, 0.69]
    Campaign D: [0.78, 0.34]
    Campaign E: [0.40, 0.34]
    Campaign F: [0.35, 0.78]
```
tab: XY图表
```mermaid
xychart-beta
    title "Sales Revenue"
    x-axis [jan, feb, mar, apr, may, jun, jul, aug, sep, oct, nov, dec]
    y-axis "Revenue (in $)" 4000 --> 11000
    bar [5000, 6000, 7500, 8200, 9500, 10500, 11000, 10200, 9200, 8500, 7000, 6000]
    line [5000, 6000, 7500, 8200, 9500, 10500, 11000, 10200, 9200, 8500, 7000, 6000]
```
````